
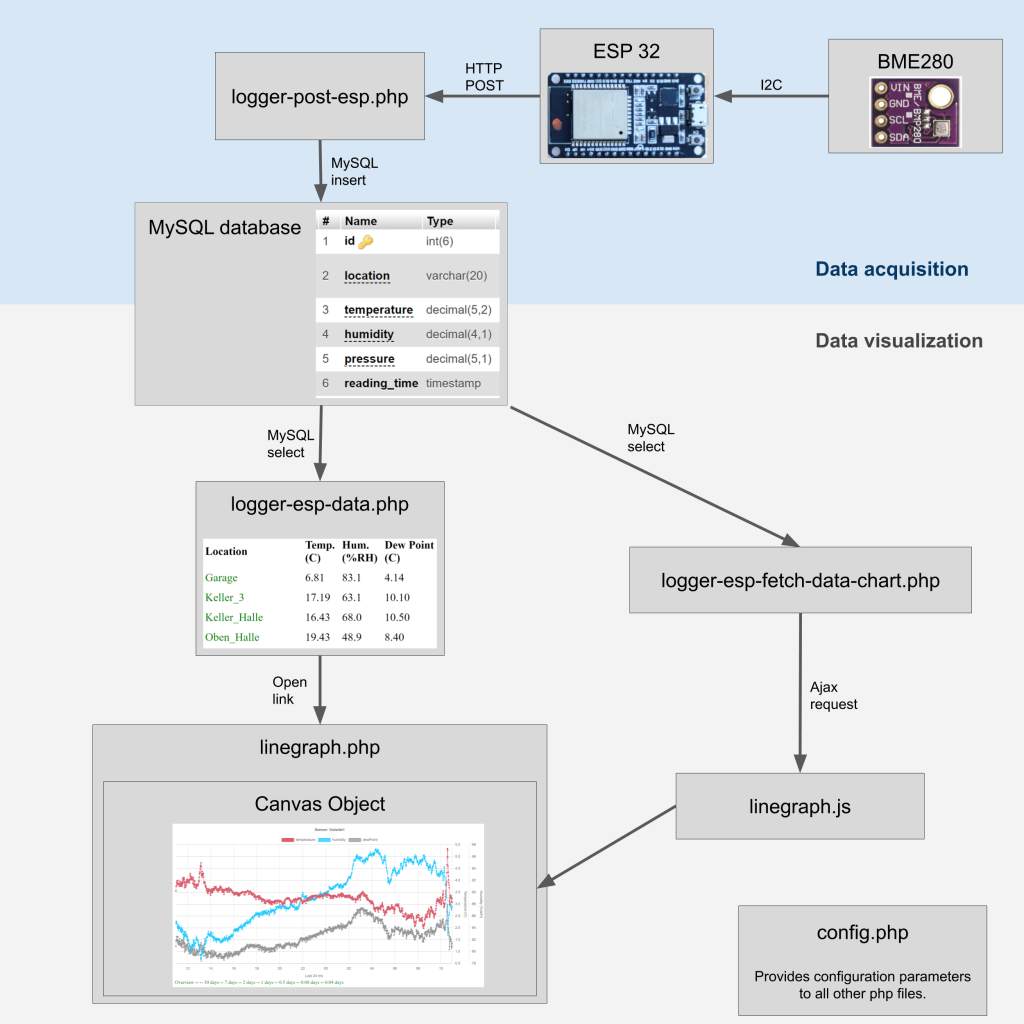
This article describes a weather station I created that uses ESP32s with BME280 sensors to push temperature, humidity and air pressure to a web server where it is displayed online. The local sensors upload data every minute to an online MySQL database, a web page written in PHP displays the most recent data points and plots graphs of the historic values. The system is now in operation with 8 sensors for some months and works very well. I have almost 1.5 million data points logged and still going strong.
Background
The basic structure of the setup is based on a tutorial I found on randomnerdtutorials. This was really the starting point for me where I re-created this example and then started to modify it. I learned that the sketch from the tutorial is a proof of concept, but it was not made for real operation. The sensor nodes lacked a lot of fail saves and the display on the web page was very basic. This prompted me to go on and improve it on many fronts. Currently, it is running many months without problems and I am happy with the current status. If you want to re-create my version I would encourage you to first read the tutorial at randomnerdtutorials and then it should be fairly easy for you to make the switch to my code. I am providing the files, but I am not explaining everything in detail.
Key features of the system:
- ESP32 based with BME280 as temperature/humidity/pressure sensors that push their recorded values to a web page
- Fail saves that allow long-term operation of the sensor nodes without freezes
- Sensor nodes implemented with deep-sleep for low power operation
- Webpage that summarizes most recent sensor values and graphs historic values
- Dew point calculation and highlighting of sensors that risk condensation and when it is more humid (higher dew point than inside) outside than inside.
Local Sensor Node
On the ESP32 side (the local sensors) I worked on increasing robustness. The basic idea is still the same as from the tutorial, but that code did not run robustly for me. It took some time (months…) to really track down all the errors, as some would only occur once a few days and only on some sensors. Nothing more annoying than thinking finally it works robustly only to have it freeze at some point again….. Finally, I have them running consistently for months.
- Robustness of ESP32 code improved through:
- Wifi connection: There was an issue when wifi could not be established it would wait indefinitely for wifi to be started. Added a timeout.
- BME sensor fail: If the BME 280 sensor can not be initialized correctly it pushes a dummy datapoint to the server. This way one can see whether the ESP32 stopped working or if the BME sensor is broken. Otherwise, all you see is that a sensor is not pushing data, not knowing the reason at all.
- Added a watchdog timer. It will restart the ESP after some time elapsed. If all went well, the ESP will go to sleep long before the timer is activated. Kind of brute force method, but I think it is really effective.
- Additional functionality:
- The code features a deep-sleep mode. Once the data is uploaded it goes to deep-sleep. It supposedly will allow for battery operation, but the dev boards I have are not built for low power operation and thus I ended up having all sensors plugged in.
- Polynomial correction of the humidity readout based on a calibration. I used the “salts in a jar” method – more on that in another post.
Database
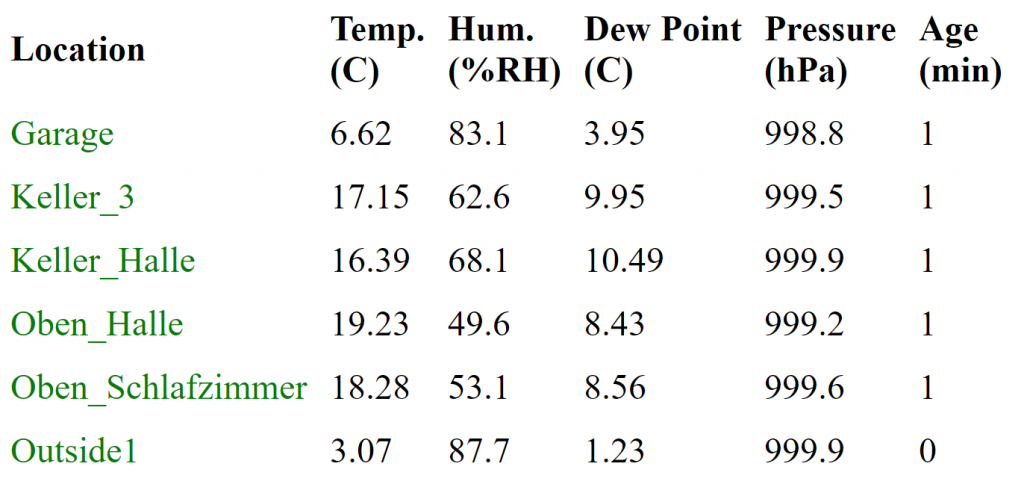
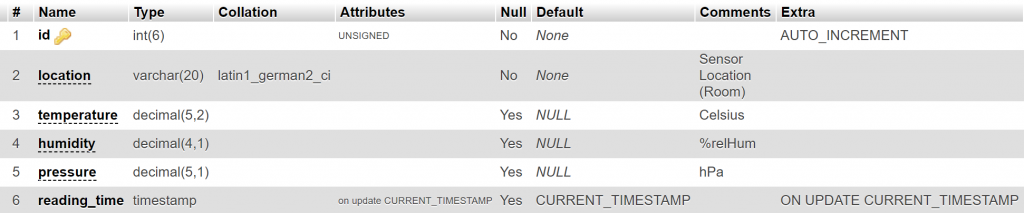
The database itself is quite straightforward, just one spread sheet. I thoughts quite a bit on how to best represent the individual sensors. In the end I decided that each local sensor gets a name hard-coded and will always push that one as well to the database. This has the advantage that it is simple to add/remove sensors, as the webpage does not need to be modified with a new sensor. All you have to check is what unique locations (aka sensor name) are in the database and display them accordingly. The other values temperature, humidity and pressure are easy. The dew point is calculated new every time, as the calculation is anyways only based on temperature and humidity.
Online Data Display
The web page pulls the data from the database for display. It shows the most recent datapoint from all unique locations (=sensor names) it found in the database. If the latest value is older than 15 min it will grey out the value to highlight it is probably not up to date any more. If the latest value is > 24hrs the sensor will not be shown any more. That is also a very convenient feature to keep the list of locations down to working sensors.
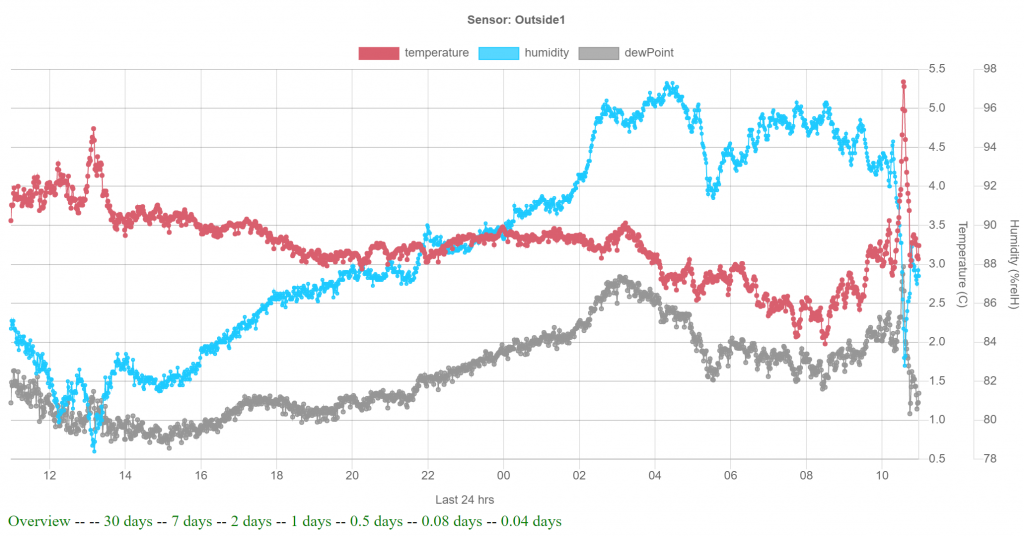
Additionally, the data from each sensor can be plotted. The time window to be plotted can be set, standard is that it shows the last 24hours, but also longer windows are possible. Right now I am not reducing the number of datapoints, therefore the load times get quite long if the window is greater than a few days.
To created the graphs Chart.js is used – works fairly well and does all that is needed.
Files
The following files are included in the the download link below. I tried to comment everything and also highlight where changes are needed, there are quite a few. Mainly to set your own link to the server, the database credentials and the key that is used to check the validity of the sent data.
- esp32_push_to_cloud.ino: Arduino file for the ESP32.
- create sql database.sql: Code snippet that creates the database structure. Use phpmyadmin or similar to create the database structure or just manually create it your own.
- logger-post-esp-data.php: File is called by the ESP and pushes the received data to the database.
- logger-esp-data.php: Creates the summary table of the latest sensor readings.
- linegraph.php, linegraph.js: Files to create the line graph. The php file creates a basic html page and the Java Script creates the plot.
- logger-esp-fetch-data-chart.php: Fetches the data from the database in JSON format to display in linegraph.js.
- config.php: Contains the parameters for the database etc. and for some customization for the web page displays.
- Chart.js: Needed to create the linegraph. I used version 2.8.0, download at www.chartjs.org and save in /js subfolder.
Closing Remarks
- I am not sure how secure the whole setup is. This is also the reason I am not showing the actual link to the operational web page. Not fully trusting it to open it up to the world.
- Most tricky part of the whole project was to create sensor nodes that work reliably. There are so many unlikely events that can happen that make the sensor freeze. Plus, there is very little feedback you get, only a sensor that has power, but does not push data any more. I think now I found most problems and have reliably working solution.
- Really happy how the whole system turned out and it is really nice to have it running and showing me the “climate zones” in our house. I’ll plan to write a more in-depth article on what I learned regarding indoor climate.
Hi I tried to open your rar file but it comes up with unknown format error, is there any chance of getting a fresh copy thanks John
Hey John – just tried again and for me it works perfectly.. Did you use winrar to extract the files?
Great project thank you – we are a group of school students attempting to make robust farm sensors. If you followed Rui and Sara’s random nurds tutorial, you may have hosted the solution. We have used Bluehost and we found that this line of code was necessary to accurately use the MySQL data (line inserted immediately after the // Check connection code) in logger-esp-data.php
$conn->query(“SET time_zone=’$timezone’;”);
Hey Tim, thanks for the info and good luck with your school project!
Hi, I am getting the following error when running linegraph.php
Notice: Undefined index: sensorName in C:\xampp\htdocs\zxc\linegraph.php on line 47
Overview — “); print(strval(round($time,2)) . ” days “); } ?>
Any assistance would be greatly appreciated. Thanks.
Hey! Did you run the script while passing the sensorName value correctly when calling line graph?
You need to also add the sensor you want to plot to the call for line graph. Along the lines: linegraph.php?sensorName=Outside
Hello,
great project.
I have some trouble, I get response: HTTP Response code: 200
Nothing happens
Any ideas whats wrong?
BR
Jorgen
Hey, thanks for the nice comment.
200 means that the http request was OK. Perhaps the error is somewhere else?
Best,
Thomas
Hi,
Nice Project. I have sensor data loaded. When I call the linegraph.php, below is what I receive.
Overview —-** — 30 days — 7 days — 2 days — 1 days — 0.5 days — 0.08 days — 0.04 days
If I click “Overview” I get the esp-data page showing latest sensor reading. I believe I have the chart.js downloaded correctly. I then created a “js” folder in htdocs and put all the chart related files in there. I did change the linegraph.js to include correct path to the esp-fetch-data. From there I can run esp-fetch-data [by itself] and get pages of sensor data. I also qualified the line in linegraph.php where the linegraph.js is called [print (“http://htdocs/linegraph.js]
Question is what am I missing to get the graph to display. Appreciate your help and look forward to hearing from you.
Thank You
Do you call linegraph correctly by also adding the sensor name to the call? Such as:
linegraph.php?sensorName=Outside
I am stuck on this as well, do we change the code in $sensorName = str_replace(” “, “”, $_GET[“sensorName”]); ?
Hey, no need to replace this. This is the line that gets the data from the url. As I said in the previous comment you have to call the page with ?sensorName=…. To tell the script what sensor to plot
el gráfico es en tiempo real?
I have had four sensors running successfully for over a year. On 12/05 they all stopped working [at the same time]. Server is fine runs 24/7 only reboot is for Windows updates and no changes to Arduino or the code itself. The error in the serial monitor is below. Searched online but cannot find anything relevant. Also tried a new ESP32, but same error. Appreciate any help you can provide.
Thank You.
Regards,
Robert
Connecting
…
Connected to WiFi network with IP Address: 192.168.1.11
Humidity Measured: 48.61
Humidity Corrected: 48.61
httpRequestData: api_key=sensordata&location=Carport&temperature=26.21&humidity=48.61&pressure=1018.60
reboot
Guru Meditation Error: Core 1 panic’ed (Interrupt wdt timeout on CPU1)
Core 1 register dump:
PC : 0x40090faa PS : 0x00060334 A0 : 0x80090163 A1 : 0x3ffbe6a0
A2 : 0x3ffd5f00 A3 : 0x3ffbc6a8 A4 : 0x00000001 A5 : 0x00000001
A6 : 0x00060323 A7 : 0x00000000 A8 : 0x3ffbc6a8 A9 : 0x3ffbc6a8
A10 : 0x00000019 A11 : 0x00000019 A12 : 0x00000001 A13 : 0x00000001
A14 : 0x00060321 A15 : 0x00000000 SAR : 0x00000018 EXCCAUSE: 0x00000006
EXCVADDR: 0x00000000 LBEG : 0x4000c2e0 LEND : 0x4000c2f6 LCOUNT : 0xffffffff
Core 1 was running in ISR context:
EPC1 : 0x401054e8 EPC2 : 0x00000000 EPC3 : 0x00000000 EPC4 : 0x40090faa
Backtrace: 0x40090faa:0x3ffbe6a0 0x40090160:0x3ffbe6c0 0x4008e3eb:0x3ffbe6e0 0x400dbd5d:0x3ffbe720 0x40110c02:0x3ffbe740 0x40105971:0x3ffbe760 0x40081ecb:0x3ffbe790 0x4008103c:0x3ffbe7b0 0x40081bc5:0x3ffbe7d0 0x4008548d:0x3ffbe7f0 0x4016e7e7:0x3ffbc590 0x400dcbd2:0x3ffbc5b0 0x4008fdd9:0x3ffbc5d0 0x4008e5e5:0x3ffbc5f0
Core 0 register dump:
PC : 0x4008f5ea PS : 0x00060434 A0 : 0x800907c1 A1 : 0x3ffcdae0
A2 : 0x3ffbf4b0 A3 : 0x0000cdcd A4 : 0xb33fffff A5 : 0x00000001
A6 : 0x00060223 A7 : 0x0000abab A8 : 0x0000abab A9 : 0x3ffcdbf0
A10 : 0x3ffd5eb8 A11 : 0x4010fa48 A12 : 0x40082404 A13 : 0x401194bc
A14 : 0x000000f5 A15 : 0x00004730 SAR : 0x00000018 EXCCAUSE: 0x00000006
EXCVADDR: 0x00000000 LBEG : 0x4000c2e0 LEND : 0x4000c2f6 LCOUNT : 0xffffffff
Backtrace: 0x4008f5ea:0x3ffcdae0 0x400907be:0x3ffcdb10 0x4008e34b:0x3ffcdb30 0x4008e455:0x3ffcdb70 0x400823f1:0x3ffcdb90 0x40112293:0x3ffcdbb0 0x4010fa66:0x3ffcdbd0 0x4010cd1a:0x3ffcdbf0 0x4009501b:0x3ffcdc10 0x4008e5e5:0x3ffcdc50
Rebooting…
ets Jun 8 2016 00:22:57
rst:0xc (SW_CPU_RESET),boot:0x13 (SPI_FAST_FLASH_BOOT)
configsip: 0, SPIWP:0xee
clk_drv:0x00,q_drv:0x00,d_drv:0x00,cs0_drv:0x00,hd_drv:0x00,wp_drv:0x00
mode:DIO, clock div:1
load:0x3fff0018,len:4
load:0x3fff001c,len:1216
ho 0 tail 12 room 4
load:0x40078000,len:9720
ho 0 tail 12 room 4
load:0x40080400,len:6352
entry 0x400806b8
Hey, don’t really know what is going on. Since I had this one running I also had some problems that Sensor would stop working, but never this error. Did you try running a simple sketch to confirm the esp is working? For me seems more like the esp has some problems.
Hi, what a amazing job! Thank you very much for your sharings.
I have same problems with the question above.
When I call the page linegraph.php?sensorName=withmysensorname,
below is what I only receive without any charts.
Overview —-** — 30 days — 7 days — 2 days — 1 days — 0.5 days — 0.08 days — 0.04 days
I added js files inside public_html/wp-includes/js, and wp-admins/js, maybe do I have to put the folder in the specific location? I put also in the public_html.
It will be very helpful if you could answer this question.
Thanks.
Overview —-** — 30 days — 7 days — 2 days — 1 days — 0.5 days — 0.08 days — 0.04 days
Did you click on an item, e.g., “2 days”. Each label above is a link to retrieve the specific records for that label and then will display the chart for the data retrieved.
Hello, I’m from Bulgaria can you help with a code ESP 32 dev module. I have to post days of three sensors 1 BME 280 + 2 Ds18b20. И would be grateful if you could help.
Hello! Great tutorial.
I am having an issue with the include of esp_deep_sleep.h.
It says that I don’t have it, but I thought it was suppose to be included in the esp32dev folder of platform.io.
I tried to find it online, no success.
I tried to use Arduino IDE to download the file but also can’t find it anywhere. Can you help?
Thank you !
esp_deep_sleep.h. = esp_sleep.h.
Hi, I came across your project whilst looking to do something similar. I was very impressed and tried to use it. However I came across a problem straight away. I cannot install the deep sleep library as it cannot be found anywhere.
Is there an alternative or could I run a scipt without it?
I think you commented under a comment I made some time back, I am not the author. Having said that, I just looked in Arduino library[s] list and didn’t see any reference to esp_deep_sleep.h
Here are some links, a Google Search and two links from Github which may help you.