Use a Digital Temperature Sensor to Control the Temperature of a Neopixel / WS2812B Strip
Recently, I started playing with the Neopixel (WS2812B) individually addressable digital led strips. For the project I have in mind the tightly packed 144 led per meter strip seems the best solution. However, having some experience with leds, I was not sure about the temperature a strip could reach when run at high brightness levels for some time.
So I decided to measure the temperature on a strip of 8 leds as a function of the brightness value.
Setup
In order to measure the temperature of the 8 led strip, I cut open the protecting transparent cover and inserted a small temperature sensor (DS18B20) on the side of the led. Additionally, I record the ambient temperature (also with a DS18B20). The strip looks like this:
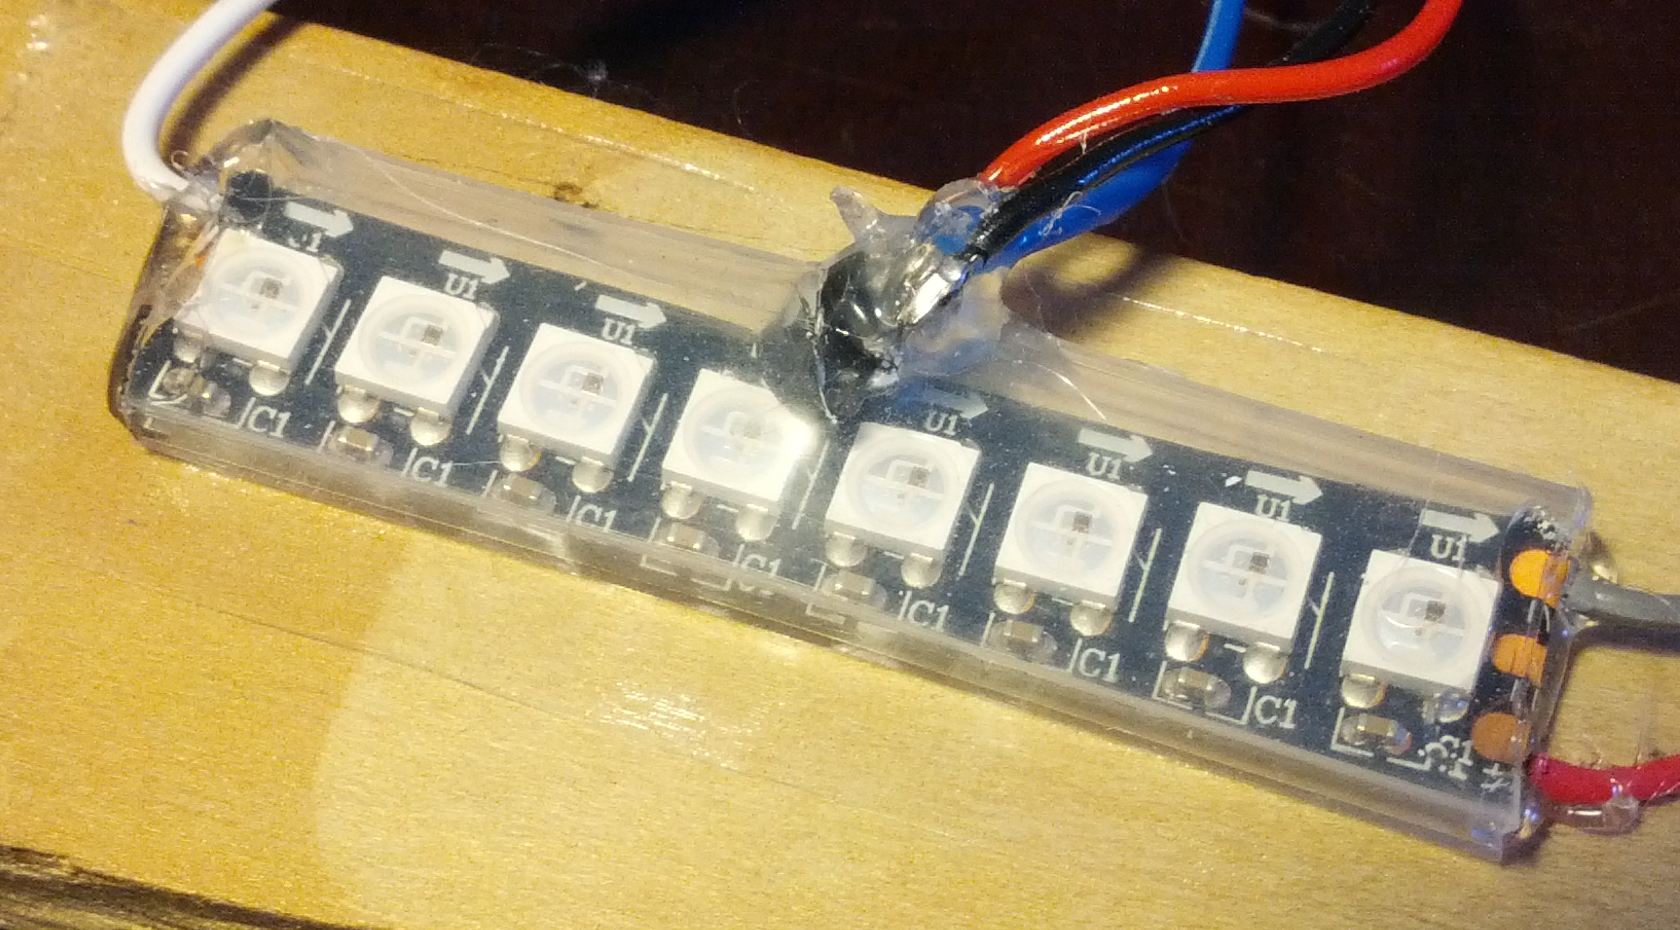
In the center you see the cables for the temperature sensor, on the left is the signal wire and on the right the voltage supply.
To actually test the strip, I wrote an arduino program that monitors the temperature and slowly increases the brightness value. I had the code set so that the level was kept constant for one minute. If the level reached 255 (the maximum) it went back to zero and started again. At all times I treated the colors equal, set to the same brightness. As I was not sure how the mounting would affect the temperature, I tested two different conditions:
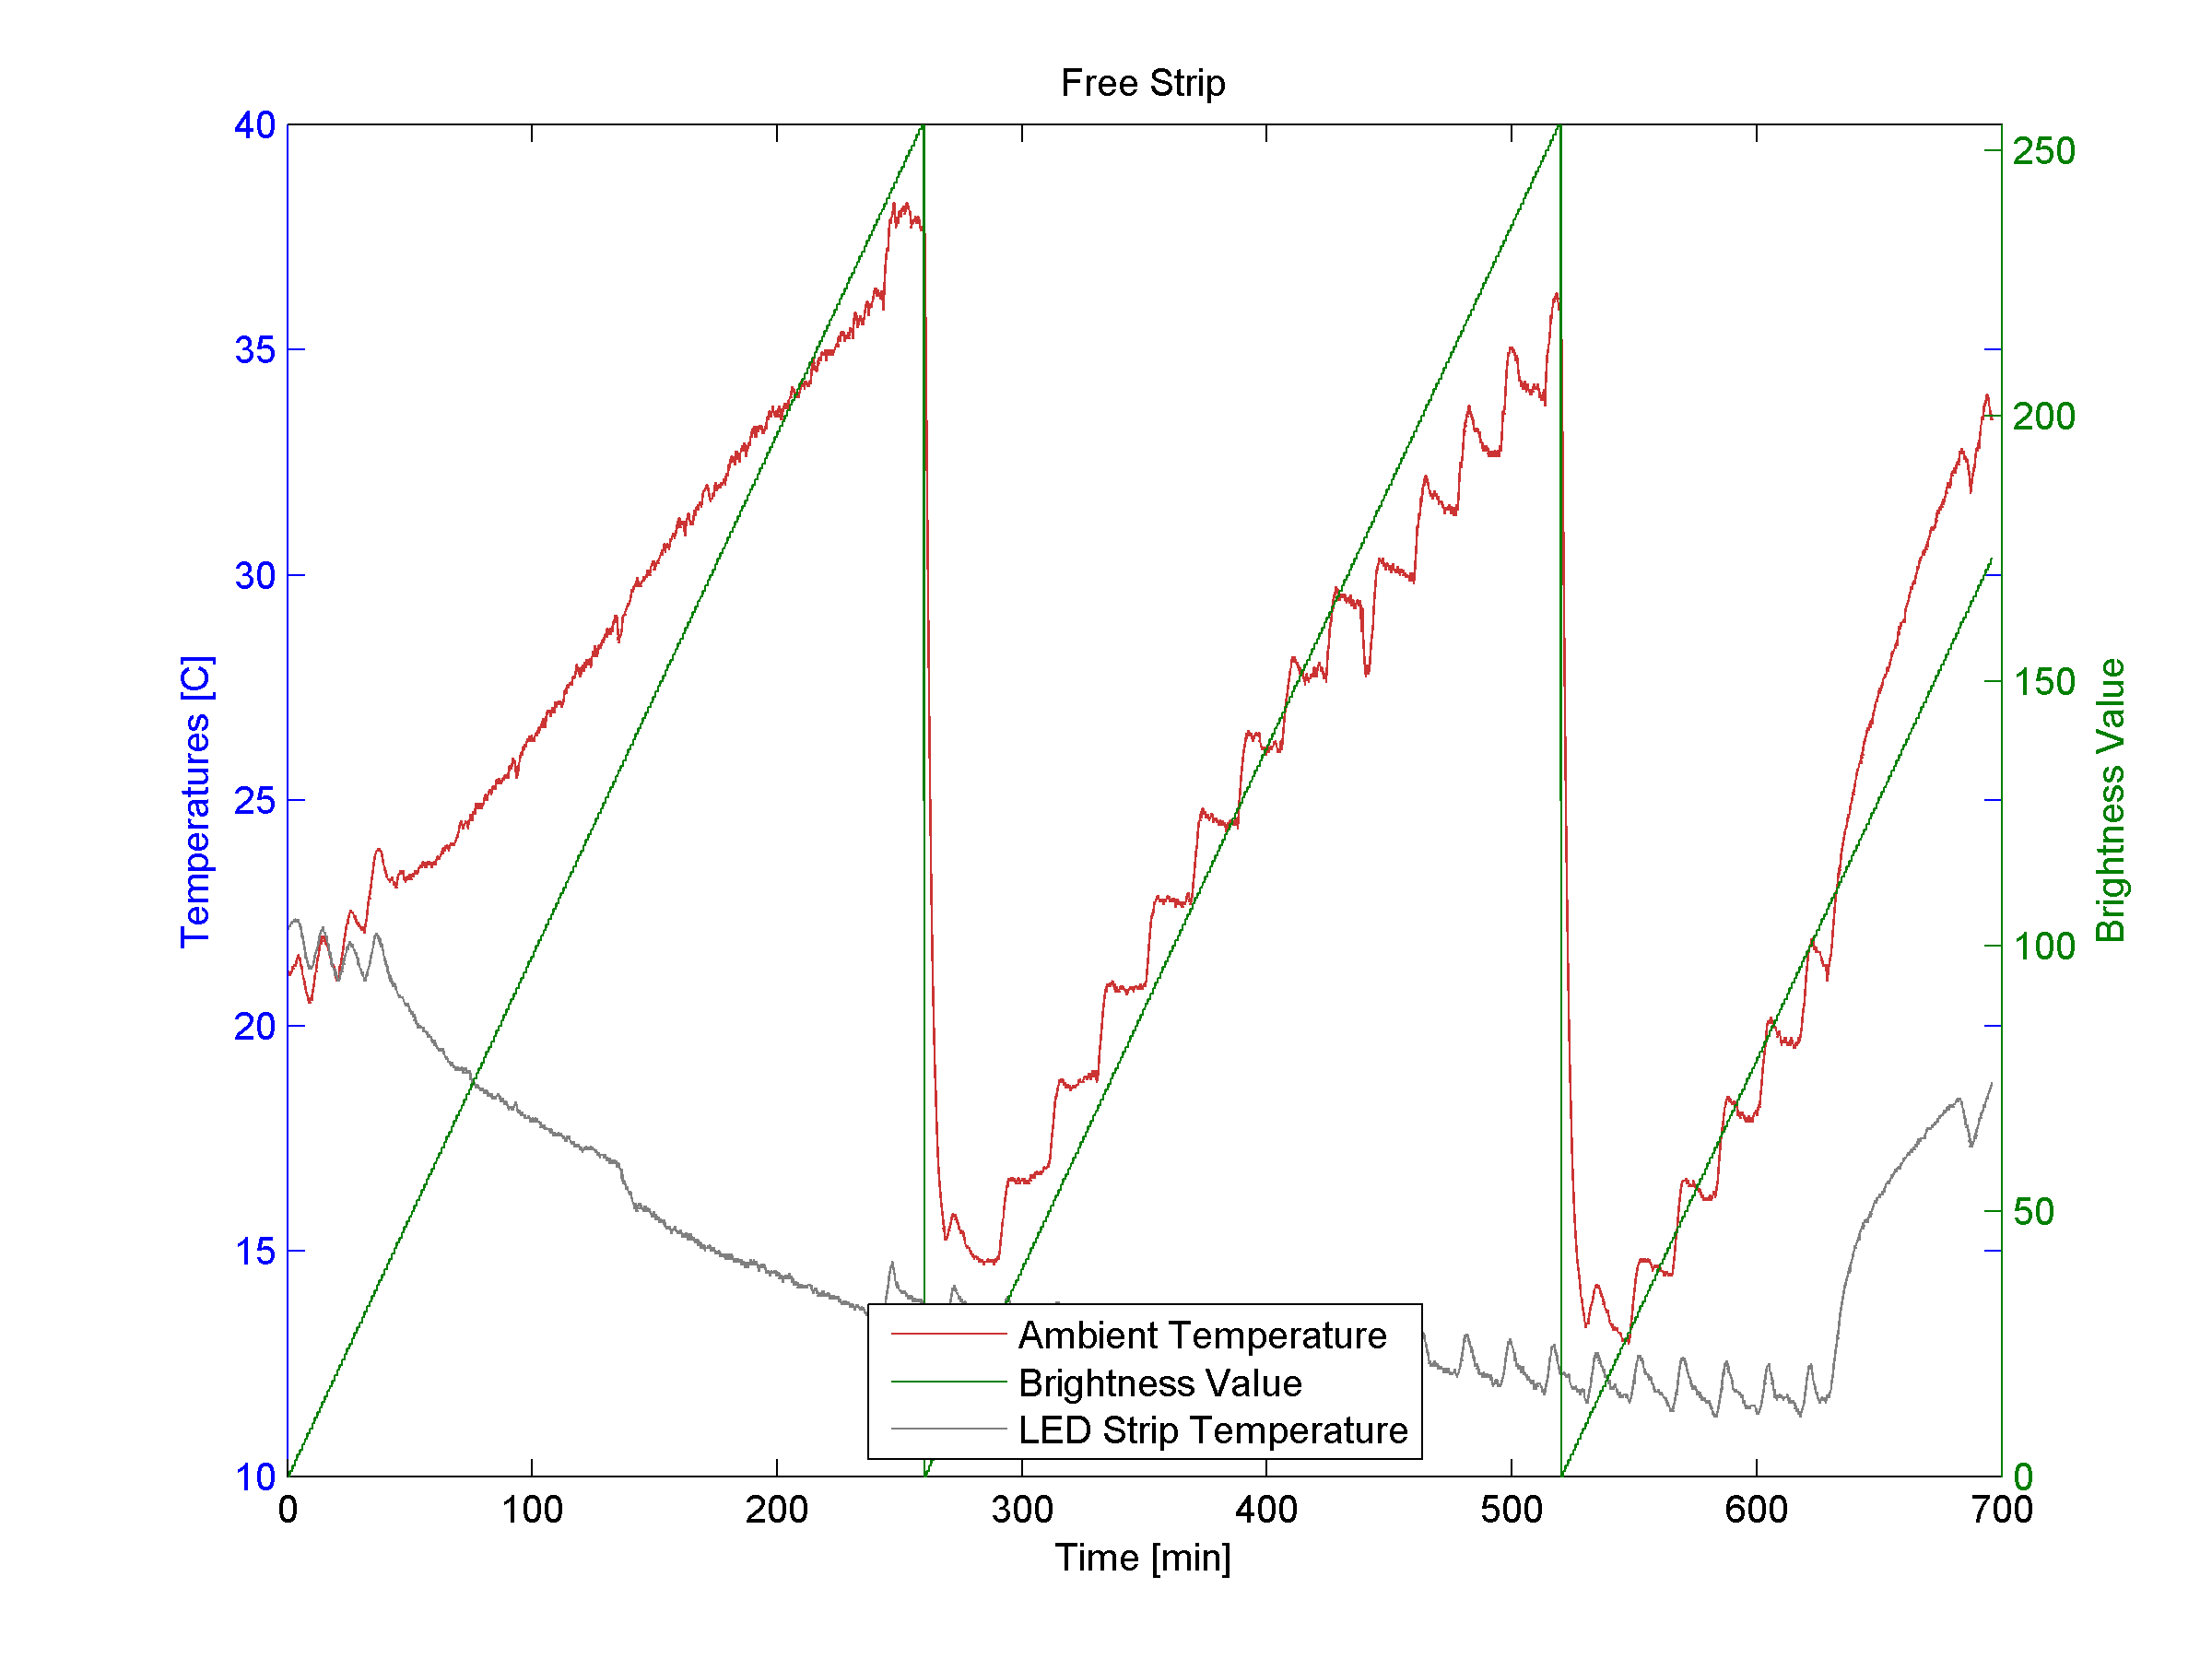
- The strip was not attached and was lying on the table, slightly elevated due to the supply cables.
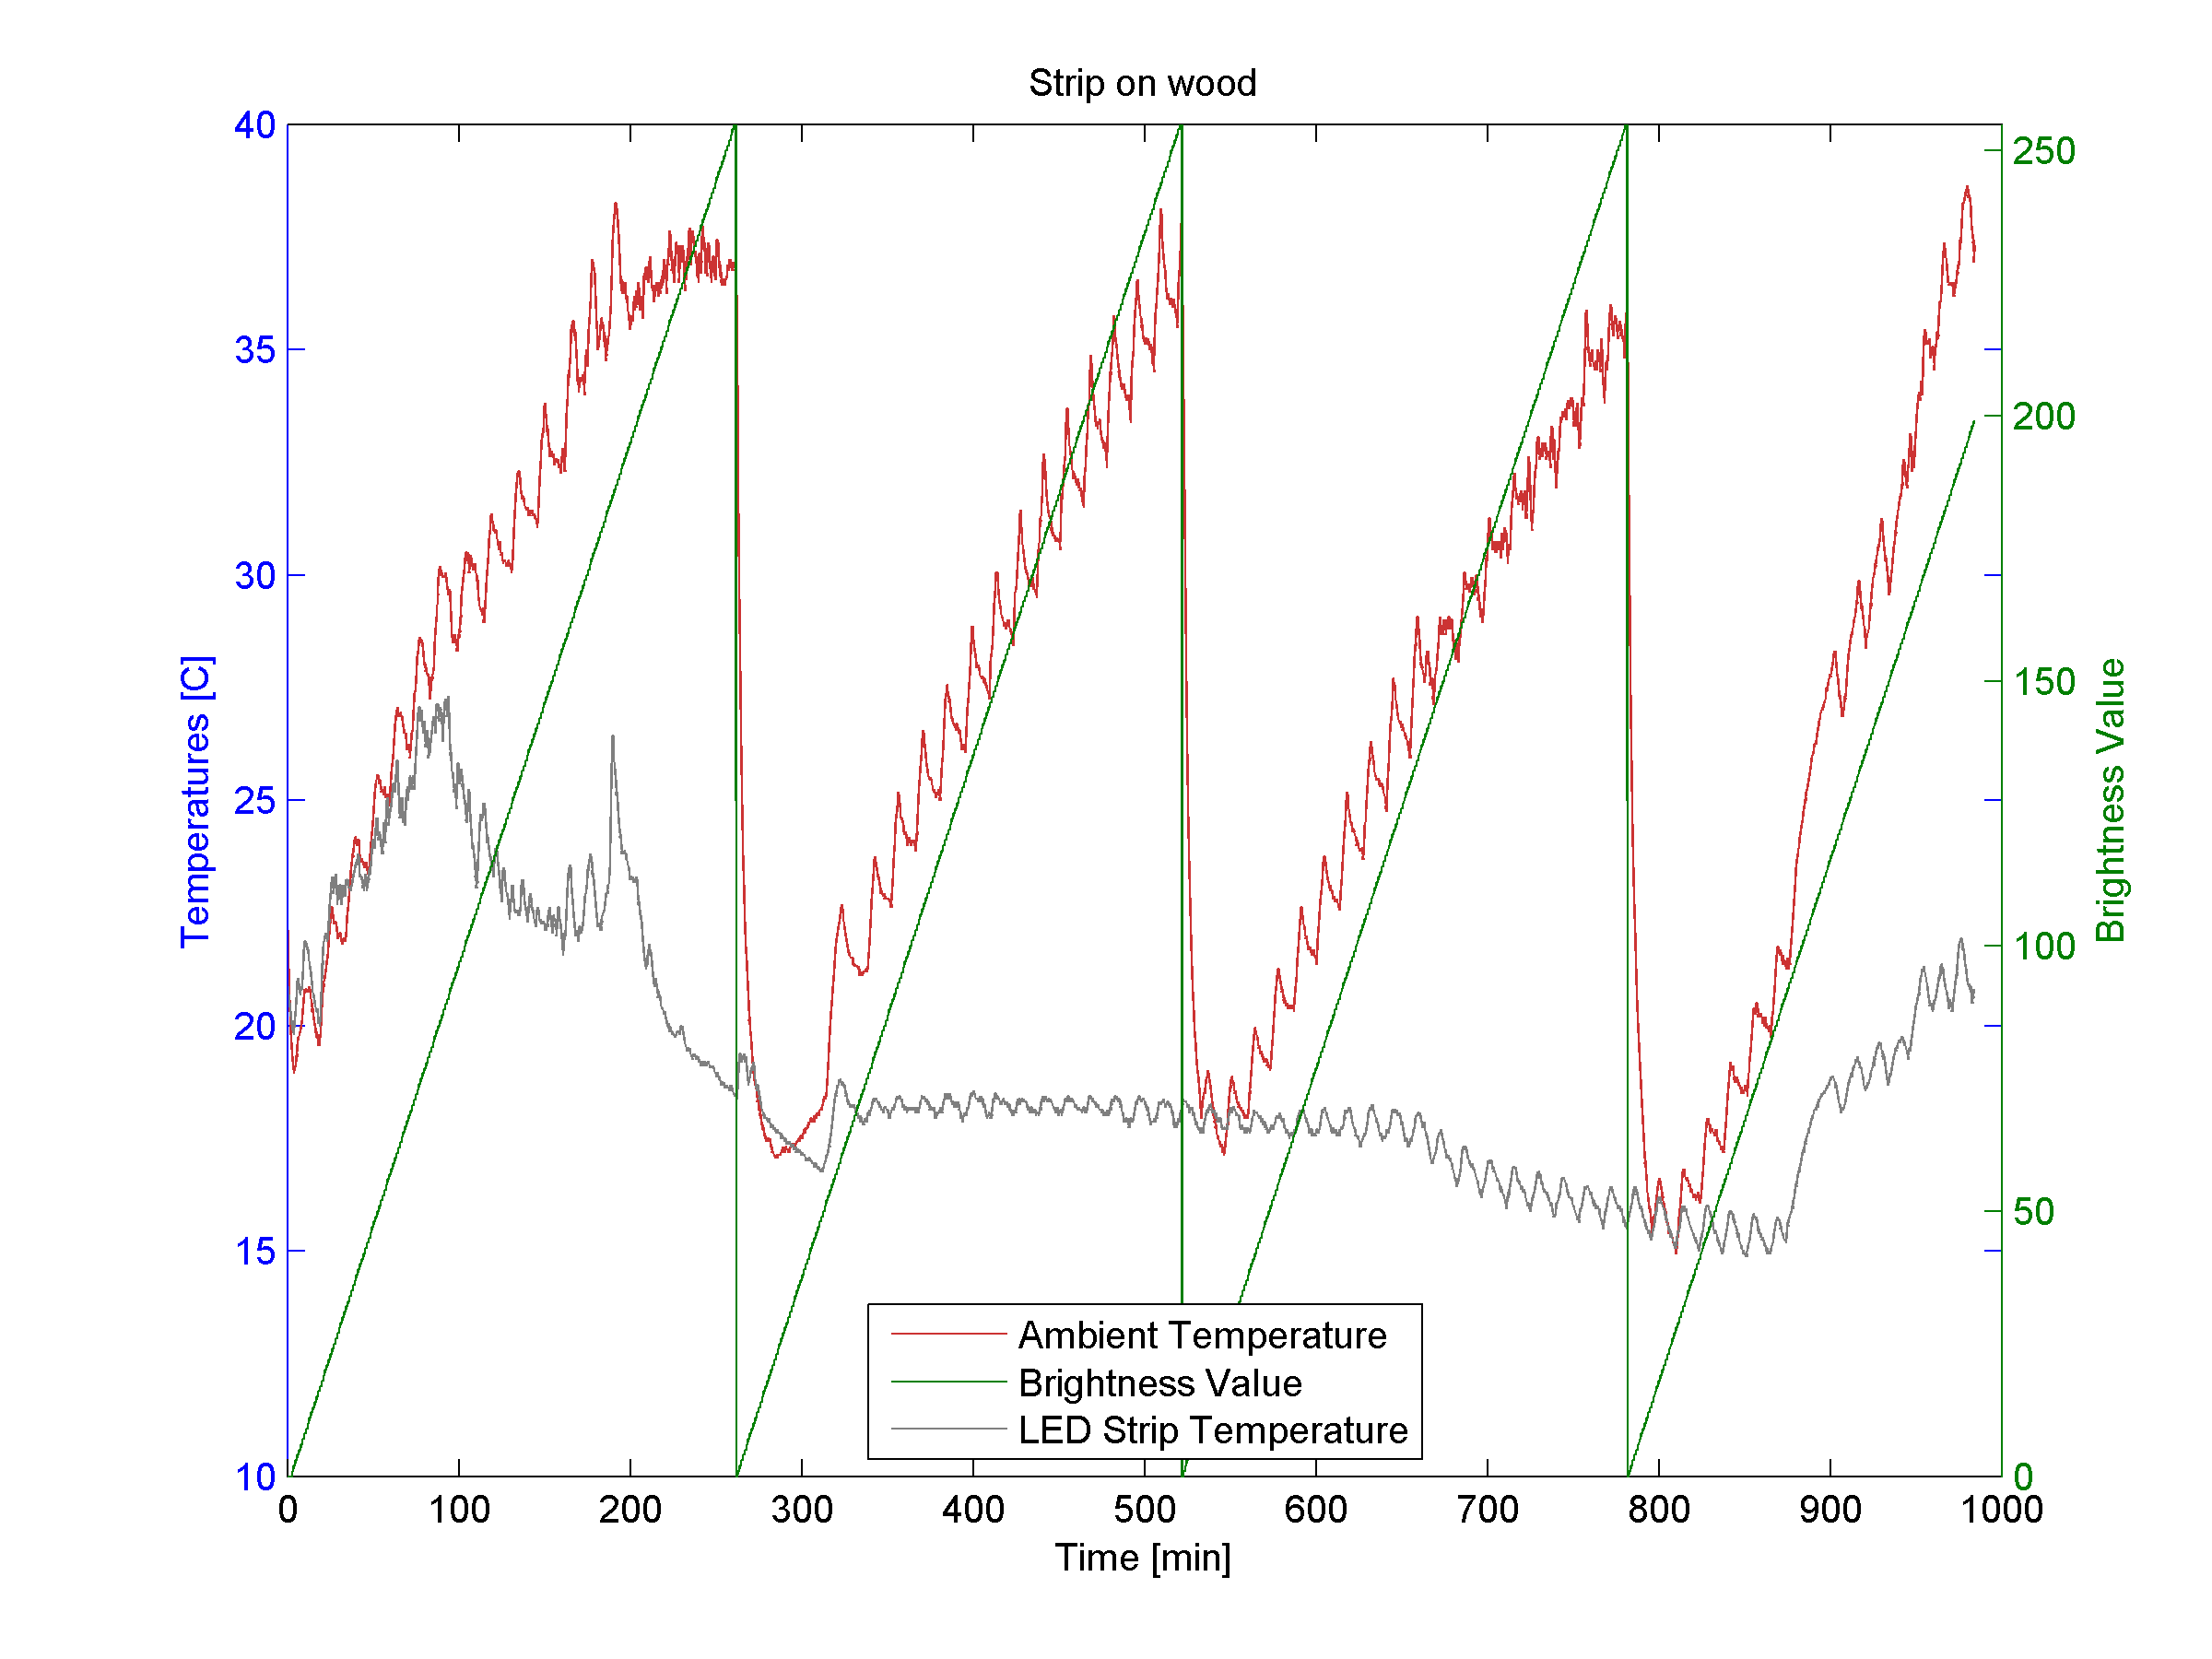
- The strip was attached to a piece of wood (as shown in the picture above). The idea was that the insulation of the wood might reduce cooling and thus increase the temperature.
Measurements
And finally, and perhaps most interesting, the strip temperature (above ambient temperature) as function of the brightness value. 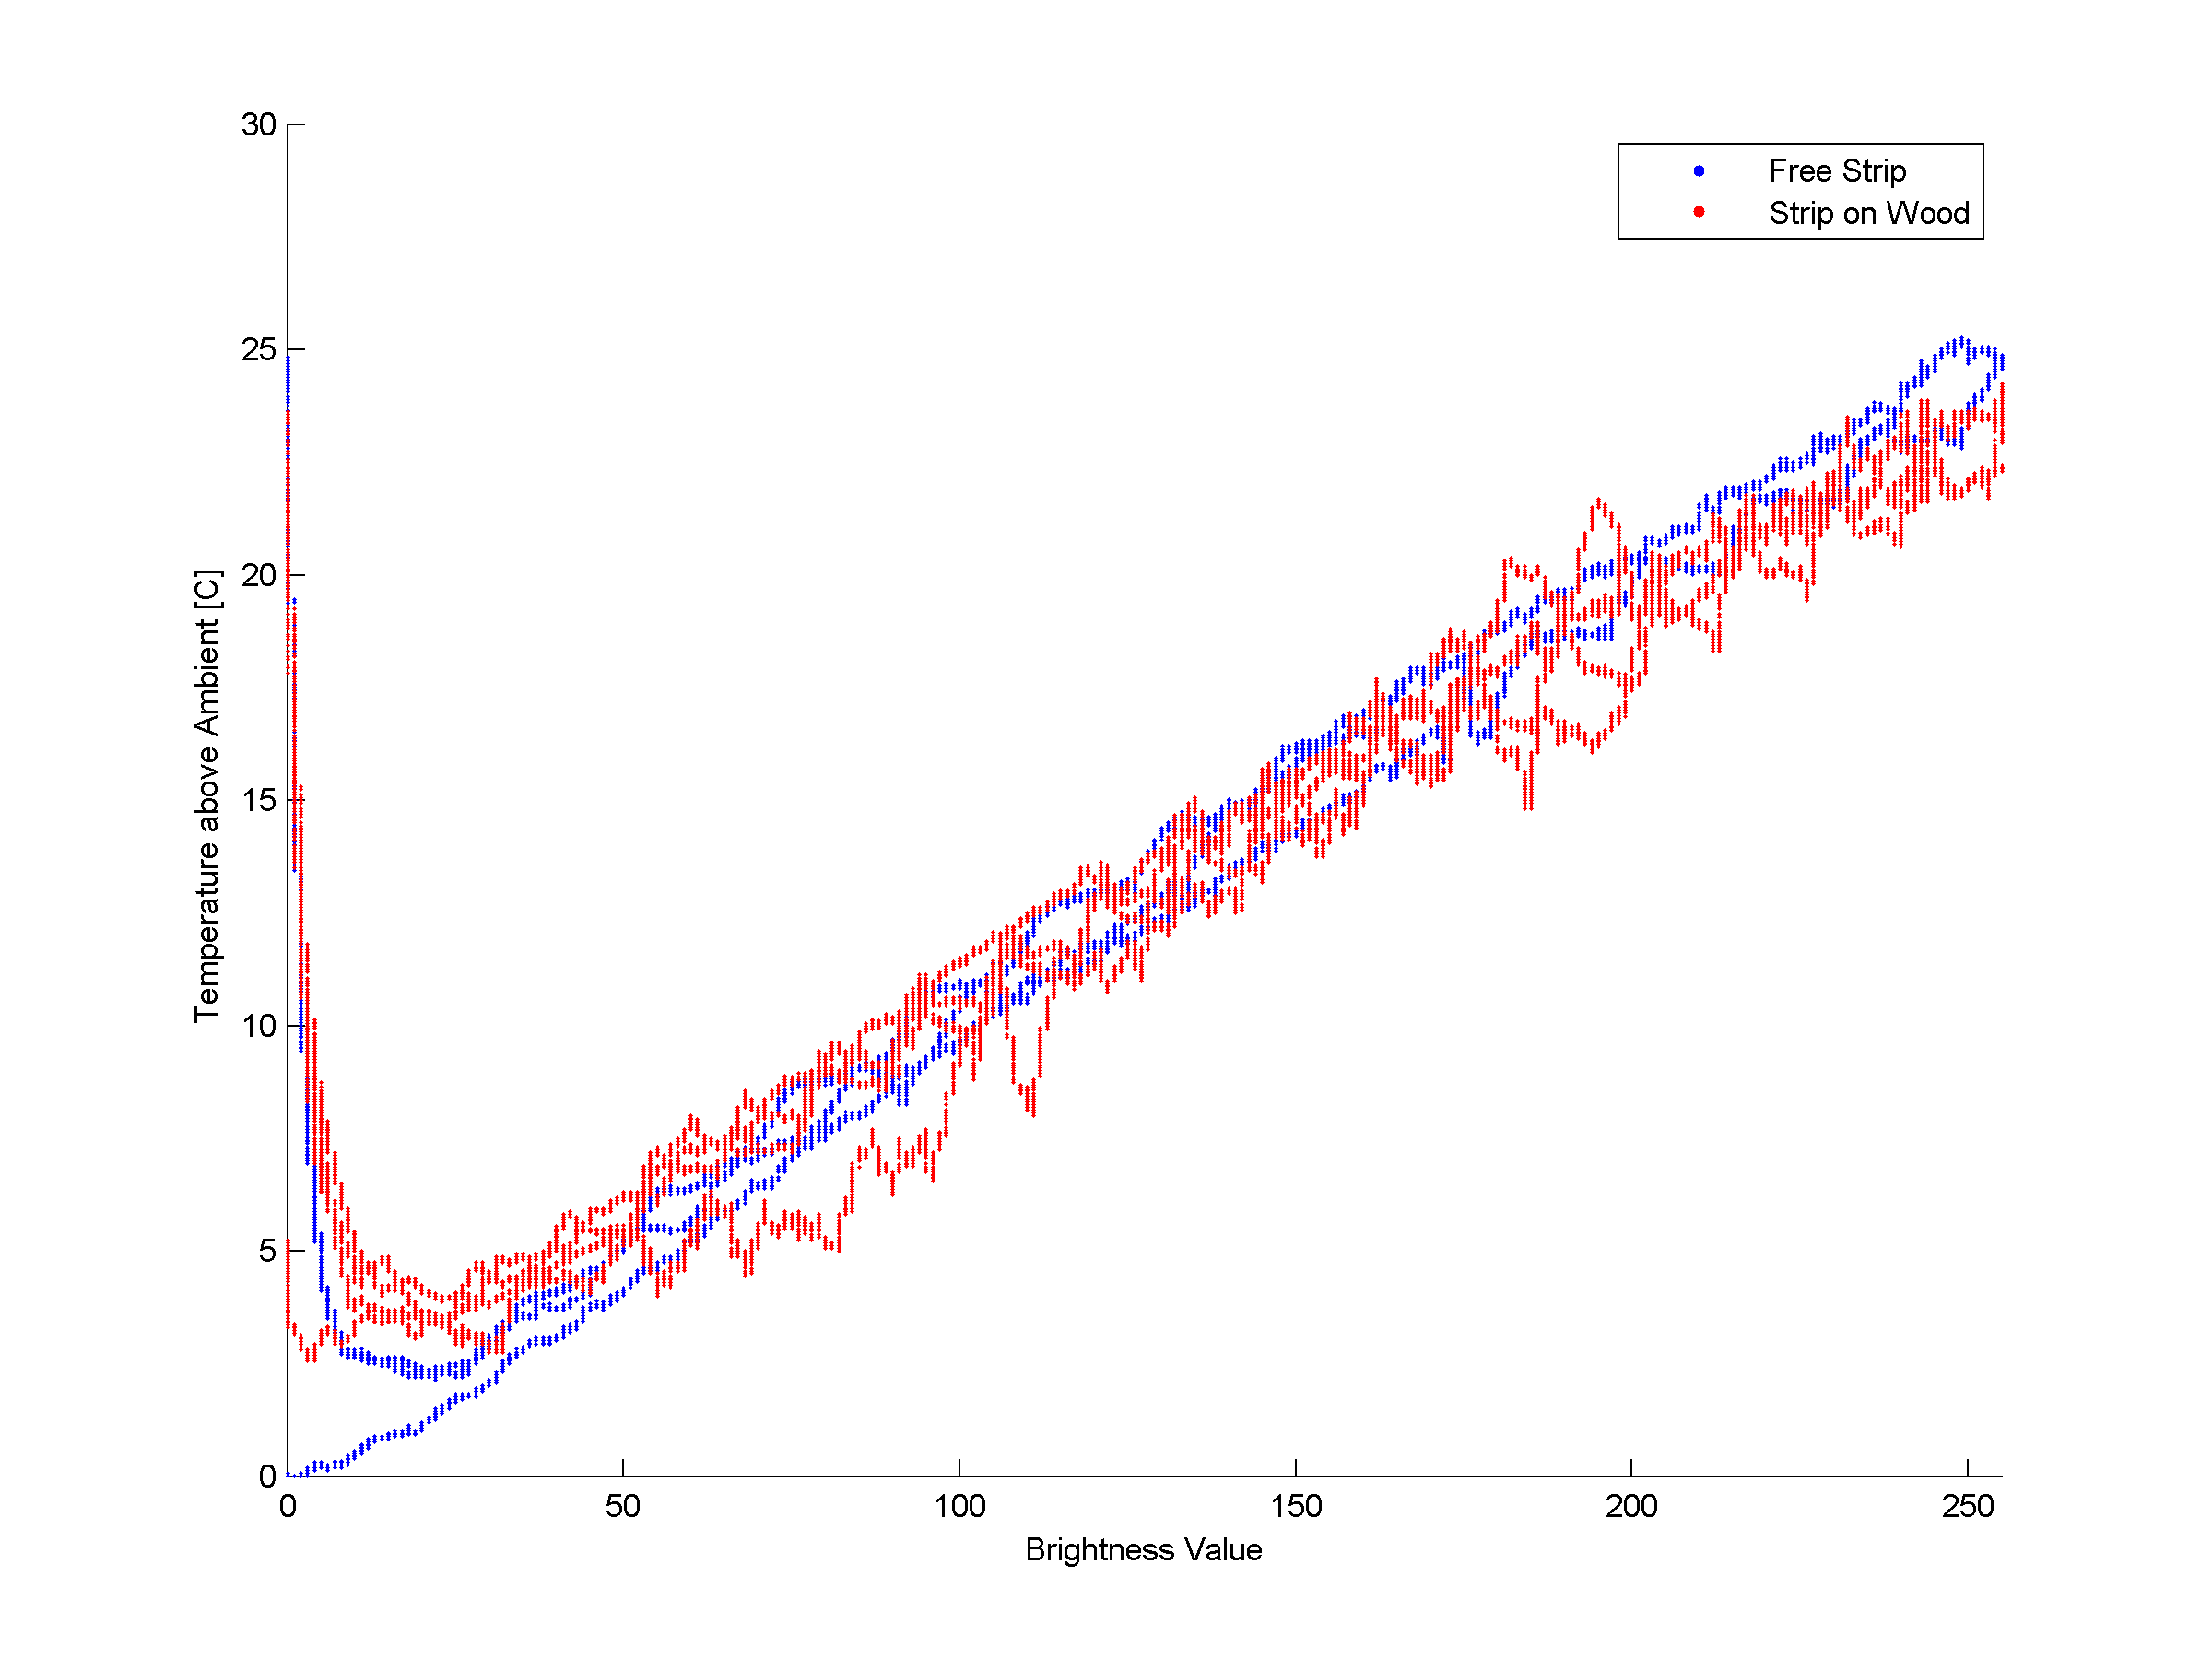
Thoughts/Remarks
- I actually expected that the temperature would rise even more. At the maximum brightness the strip was about 25C above ambient temperature. Even for hot environments that should still give a good margin.
- The attachment on wood did not change anything, at least not measurable with the crude setup.
- For the test I actually did not use Adafruit Neopixel, but rather ordered some much cheaper from ebay. They seem to work identical and have no visible defects, though of course that could potentially influence the results. The current per full bright led is about 50 mA.
- For the wood sample I used a different power supply that was not battery based. For the highest current levels it indicated that it went into “current limiting”. The supply voltage was still above 5V according to my multimeter. On the plot (temperature vs. brightness) it might appear that the strip on wood falls below the free strip for high brightnesses values. That could be an explanation.
- As I was running in winter and overnight, the ambient temperature changed a lot. More on that below.
- I am not sure how much the strip length influences the results. I think the biggest change could be that for a long strip there is also significant current though the strip, which could further heat the parts of the strip that are close to where the power is supplied.
- When the highest brightness level was reached, it jumped back to 0 and started again. That is not optimal and I should have waited some time before starting the measurement again. You can see that in the temperature vs. brightness plot where for small brightness values the temperature is still high. That is just a result of this.
Conclusion
My personal conclusion is that unless you are running the strips in super hot environments or very tightly packed, there is no need to worry about temperatures. In particular as any animation will result in average brightnesses that are well below the maximum I tested here.
Indoor Temperature Changes
As side effect of this measurement, I also recorded the indoor temperature at my apartment at my home in the USA. The house is a three story house, wooden construction and we are in the first (ground) floor. As it happend, the nights were pretty cold, with about -11 to -12 C minimum.
I started the recording in the evening and at some point I turned the heat off and went to bed. You can clearly see in the graphs that the room temperature falls from around 22C to below 15 C.
The crazy zig-zag is due to the heating system. We have forced air, which is basically a big hot air blower in the basement that blows warm air into the rooms. Combined with a poorly insulated house and less thermal inertia, this means that he place heats up super quickly, but also cools down very fast. You see that at some point the temperature falls by about 10C in almost 3hrs. That is pretty fast – 3C per hour!